
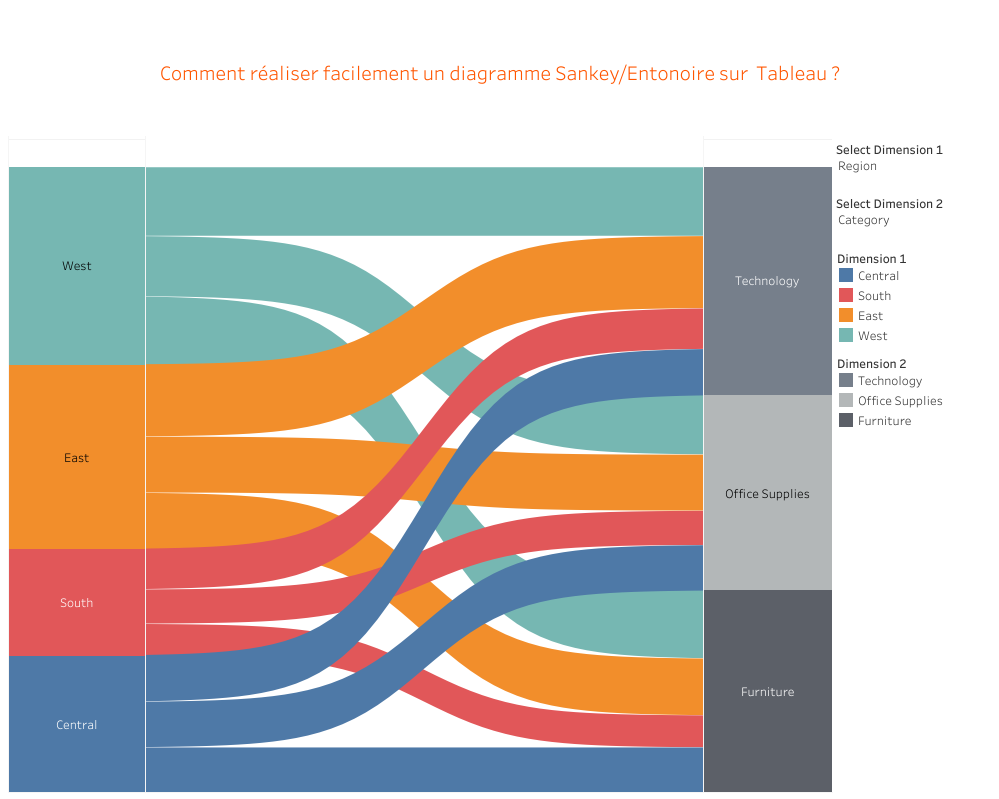
How to easily make a Sankey diagram on Tableau?
At the beginning, I would like to note that this article is inspired by the article Theinformationlab.co.uk which provides the detailed steps for building a Sankey diagram. Before sharing this article I wanted to produce and reproduce this type of diagram in order to ensure the clarity of the steps provided below, without losing this with the tedious tasks of data preparation.
You have to create 20 calculations in order to successfully complete your diagram. You are ready ? Go for it !
1. Creation of navigation dimensions and measures
First create 2 whole parameters with a list of values to be able to select the dimension to analyze:
- Select Dimension 1
Select Dimension 2
Dimension 1
CASE [Select Dimension 1]
WHEN 1 THEN [Region]
WHEN 2 THEN [Category]
WHEN 3 THEN [Sub-Category]
WHEN 4 THEN [Segment]
WHEN 5 THEN [Ship Mode]
END
Dimension 2
CASE [Select Dimension 1]
WHEN 1 THEN [Region]
WHEN 2 THEN [Category]
WHEN 3 THEN [Sub-Category]
WHEN 4 THEN [Segment]
WHEN 5 THEN [Ship Mode]
END
Chosen Measure
[Sales]
2. Creation of data densification frames
Path Frame
IF [Chosen Measure] = {FIXED : MIN([Chosen Measure])} THEN 0 ELSE 97 END
Path Frame (bin)
Créer un bin pour la mesure « »Path Frame » »
3. Calculations creation: Index, T, Sigmoid and Sankey arm sizing
Path Index
Index()
Ceci est calculé le long de Path Frame (bin) et permet de calculer à travers Path Frame.
T
IF [Path Index] < 50
THEN (([Path Index]-1)%49)/4-6
ELSE 12 - (([Path Index]-1)%49)/4-6
END
Sigmoid
1/(1+EXP(1)^-[T])
Sankey Arm Size
SUM([Chosen Measure])/TOTAL(SUM([Chosen Measure]))
il permet de calculer la taille en pourcentage de chaque branche Sankey /total data
4. Creation of high line calculations
Max Position 1
RUNNING_SUM([Sankey Arm Size])
Max Position 1 Wrap
WINDOW_SUM([Max Position 1])
Max Position 2
RUNNING_SUM([Sankey Arm Size])
Max Position 2 Wrap
WINDOW_SUM([Max Position 2])
5. Creation of line calculations at the bottom
Max for Min Position 1
RUNNING_SUM([Sankey Arm Size])
Min Position 1
RUNNING_SUM([Max for Min Position 1])-[Sankey Arm Size]
Min Position 1 Wrap
WINDOW_SUM([Min Position 1])
Max for Min Position 2
RUNNING_SUM([Sankey Arm Size])
Min Position 2
RUNNING_SUM([Max for Min Position 2])-[Sankey Arm Size]
Min Position 2 Wrap
WINDOW_SUM([Min Position 2])
6. Creation of the « »Sankey Polygon » » calculation
Sankey Polygons
IF [Path Index] > 49
THEN [Max Position 1 Wrap]+([Max Position 2 Wrap]-[Max Position 1 Wrap])*[Sigmoid]
ELSE [Min Position 1 Wrap]+([Min Position 2 Wrap]-[Min Position 1 Wrap])*[Sigmoid]
END
7. Creation of the view
- Add Path Frame (bin) to the Rows:
- Check if « »missed value » » is selected
- Move Path Frame (bin) to detail, add
- Dimension 1 and Dimension 2 to detail.
- Put T in the Columns and calculate the (table calculation) through Path Frame (bin)
- Change the mark type to Polygon
- Add Path Index to the « »Path » » and calculate the (table calculation) through Path Frame (bin)
8. Addition of Sankey polygon
- Add « »Sankey Polygons » » to « »Rows » ».
- Put Dimension 1 in « »Color » »
- Add the « »table calculations » » below for Sankey Polygons (you must change in the « »Nested calculation » » drop-down list after each verification in order to modify the calculation concerned.
9. You will have your Sankey!
At the end, you made your Sankey diagram. You can display the 2 parameters previously created in order to customize the result.
Add at the end 2 other views:
- a view which displays the measurement concerned (dirty in our case) according to dimension 1 using a bar diagram
- a view that displays the measurement concerned (dirty in our case) according to dimension 2 using a bar diagram
Thereafter, you can create a dashboard which combines the 3 sheets horizontally, I invite you to download this work from Tableau public Datadictos in order to assist you.
NB: Do not forget to check the sorting on each dimension used.